Getting started with Logging
The Konso app collects, lookups and track log events from distributed systems. To start logging in a new bucket, we need to add logging to the bucket.
To do so, navigate on the left side pane to Settings > Usage. Under Usage there is a widget named APIs as seen:
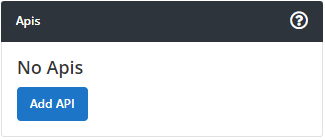
To add logging, click on Add API and a popup window appears:
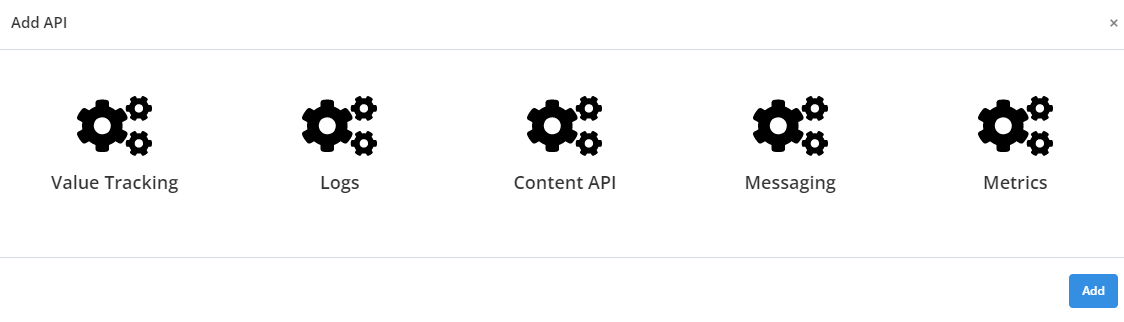
Click on the Logs icon and press the add button at the bottom right.
You can start to stream logs via the REST API to Konso using api endpoints as referenced by Logging API.
. More on the API can be referenced through the Github repository link: https://github.com/konsoio.
Logs related to a specific bucket can be viewed through a dashboard on the app.
To access the log section, navigate to the left pane of the dashboard and select Logs. Under the Logs menu there are several sub-items namely:Overview, Explore and Settings.
The Overview displays a summarized log information on events that has occurred over a given period of time. By default events that has occurred on that specific days are displayed.
The section allows a user to filter the period over which log information is to be displayed. The Overview displays the following:
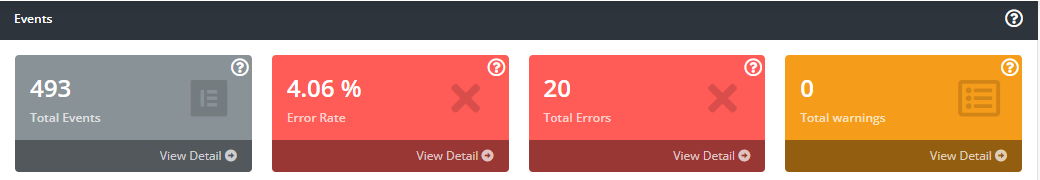
- Events The total number of events over the period of time is displayed. The total events with errors and its percentage is shown and lastly the total events with warnings are displayed.
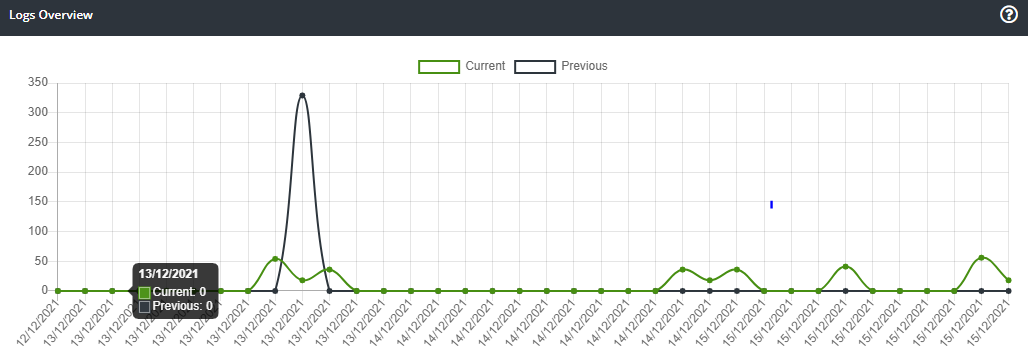
- Logs Overview The Logs overview displays a graph summary of log events for the period selected compared to the previous period.
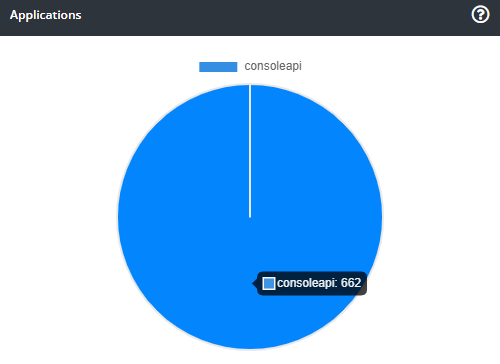
- Applications The Applications displays a pie chart which shows a summary of log events by application.
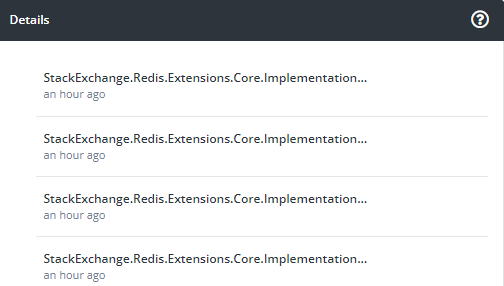
- Details Here the details on the lastest log events are displayed.
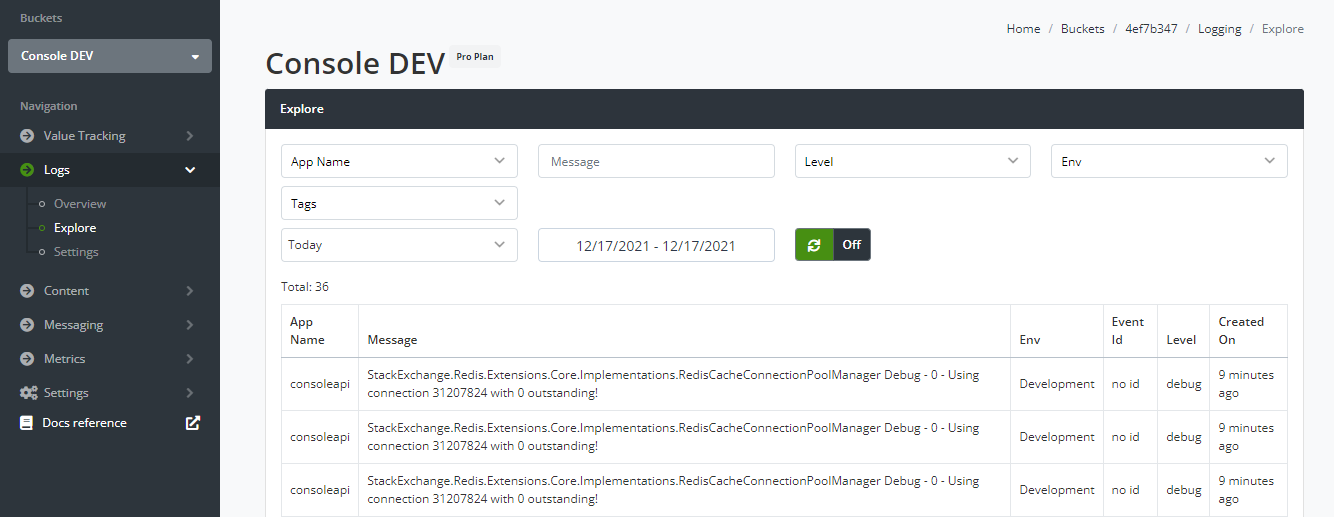
During the inquiry you are able to specify:
- App Name which allows you to choose the application that is linked to the bucket
- Message which is the detailed information about a logged event
- Level which is the level category of logged events
- Env which is the environment type of a logged event
- Tags which are labels that link associated events
- Time and date range which allows you to specify period which logged events took place
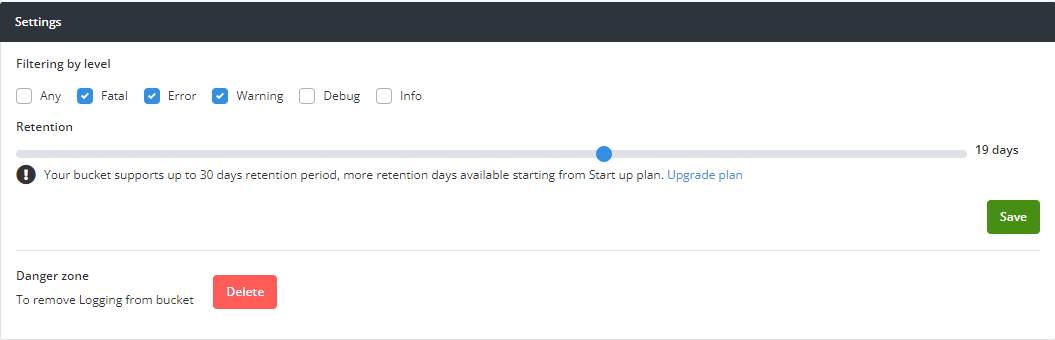
The Settings section enables you to configure the logging process of a bucket. You can configure the following:
- Filtering Level This is the category level of logged events. You can select between all of them by selecting any or Fatal, Error, Warning, Debug, Info.
- Retention This is the log retention period for your bucket based on the subscribed plan. An upgrade to your plan increases your retention period. The upgrade plan link provides a way to upgrade your current plan.
- Danger Zone Under this section is a red button named delete which enables you to remove logging service from your bucket.
Once you are done configuring you click the save button to confirm the changes made.