Getting started with Metrics
The Konso app collects, lookups and tracks performance of your project. The metrics include API requests and response time to requests.
To start collecting metrics in a new bucket, we need to add metrics capture to the bucket. To do so, navigate to the left side pane to
Settings > Usage. Under Usage there is a widget named APIs as seen:
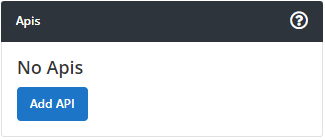
To add metric capturing, click on Add API and a popup window appears:
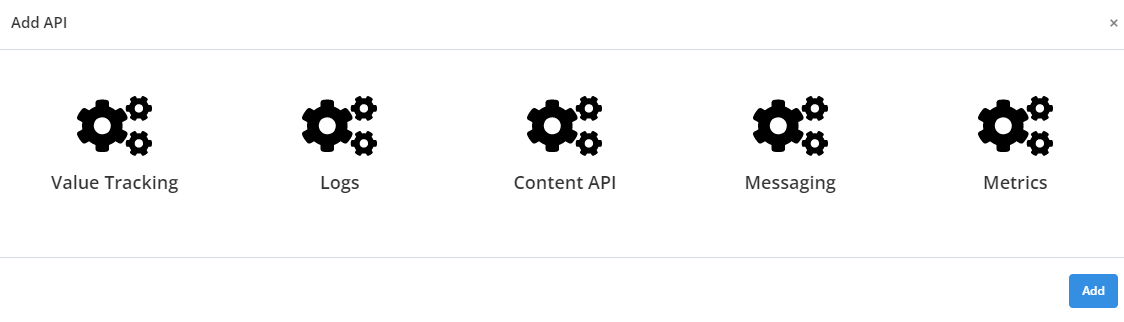
Click on the metrics icon and press the add button at the bottom right.A notification is displayed confirming successful addition of metrics to the bucket.
You can start collecting metrics via the REST API to Konso using api endpoints as referenced by Metrics API.
More on the API can be referenced through the Github repository link: https://github.com/konsoio.
Metrics related to a particular bucket can be viewed through the dashboard on Konso app. To access the metrics, navigate to the left pane of the dashboard and select metrics. The following exists under metrics: Overview, Overall, Explore and Settings.
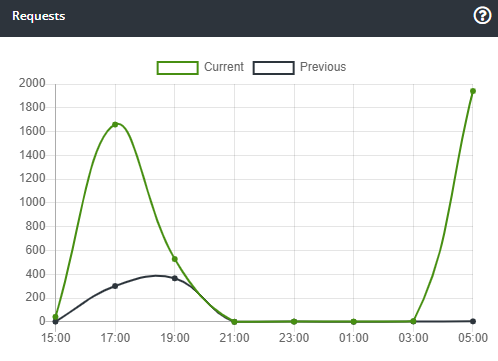
The Metrics Overview shows an aggregated metrics information collected on konso app over a period of time which can be specified on this window. The displayed information is as follows:
- Requests This displays a graphical information showing the amount of requests made over a period of time.
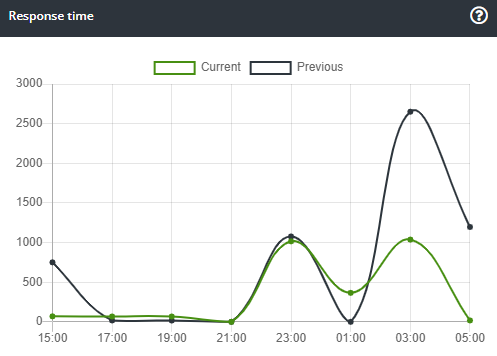
- Response Time This section displays graphical information of the average response time over a period of time.
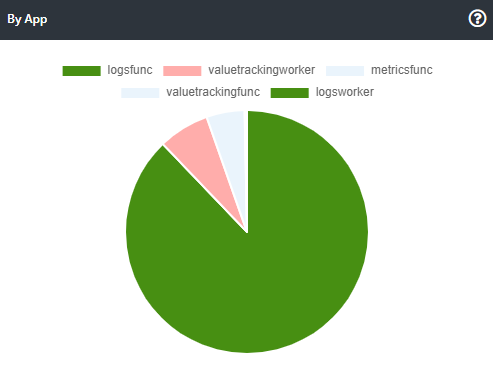
- By app The by app displays a pie chart showing the collected metrics based on application.
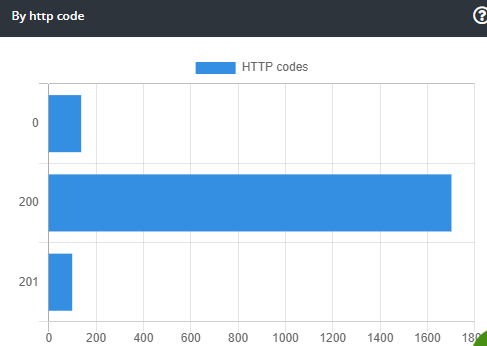
- By http Code The by http code displays a horizontal bar graph which shows metrics based on the http result code of the server response.
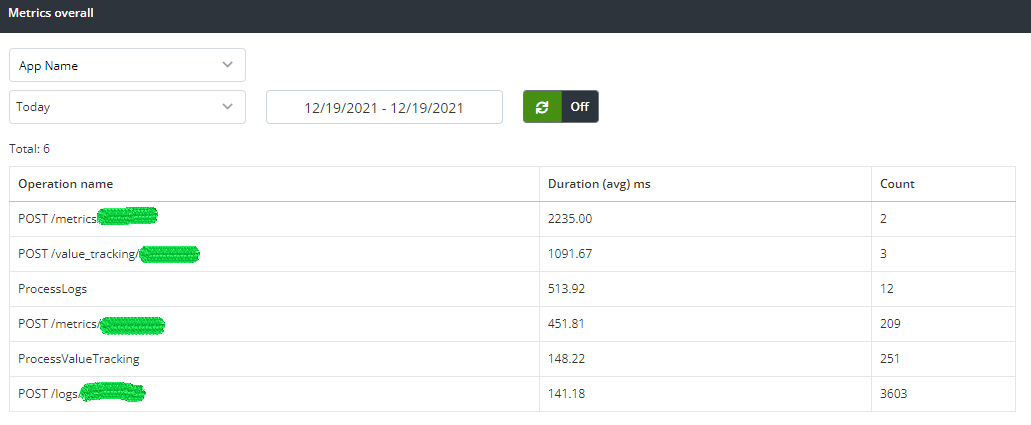
The Metrics Overall displays an aggregated summary information of the operations whose metrics were collected. The information is displayed in a tabulated format showing the operations name, average duration in milliseconds and the count. Additionally, you can filter the overall information based on the app name and duration.
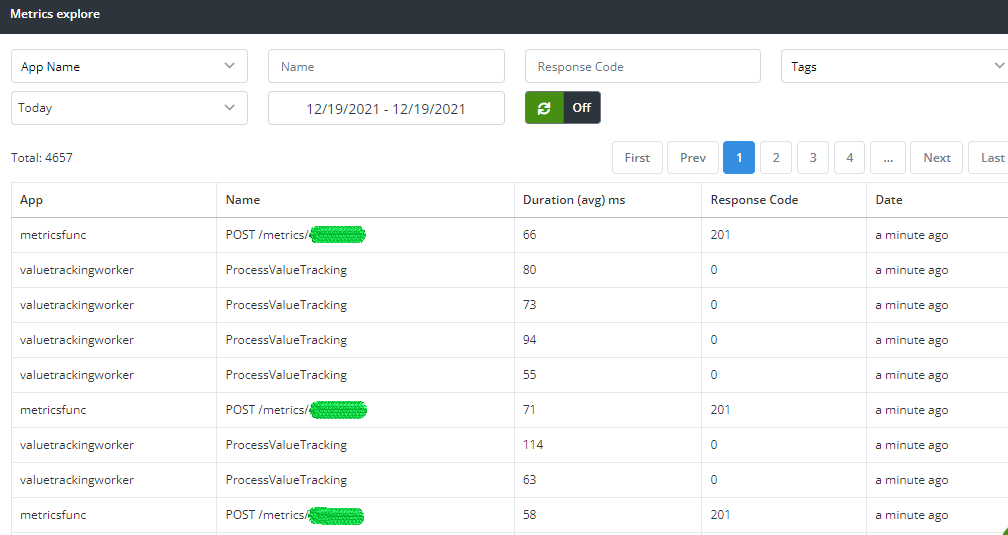
The Explore option allows you to conduct a system inquiry on collected metrics information. During the inquiry you can specify the app name, operation name, tags, response code and the period when metrics were collected. A tabulated results data is returned with the following properties: app, name of the operation, response code, date and average duration in milliseconds.
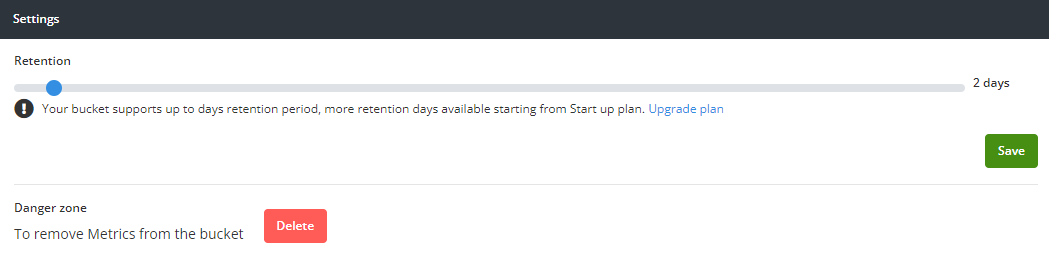
The Settings section enables you to configure the metrics data collection process of a bucket. You can configure the following:
- Retention This is the metrics data retention period for your bucket based on the subscribed plan. An upgrade to your plan increases your retention period. The upgrade plan link provides a way to upgrade your current plan.
- Danger Zone Under this section is a red button named delete which enables you to remove metrics service from your bucket.
Once you are done configuring, you click the save button to confirm the changes made.